Just installed Digital Ocean monitoring beta on one of my Digital Ocean droplets where I have Trellis running for a WordPress client of mine. It is a new way to monitor bandwidth, memory usage and I/O. And also a way to get alerts when your droplet gets hit hard on one of those metrics.
Installation Digital Ocean Monitoring Beta
Setting it up on an existing droplet was quite straightforward. Did have to reboot once. Probably as I did an upgrade running a:
sudo unattended-upgrades -d
just before I got to setting up the monitoring with this easy curl command:
curl -sSL https://agent.digitalocean.com/install.sh | sh
NB Needs to be run as root or using sudo
That ran an ssh script downloading and installing the agent. And it started working pretty quickly afterwards. Just give it like 10-15 minutes.
Monitoring Alert
I also set up a monitoring alert warning me when CPU reached 70% as well as one when memory exceeded 40%.
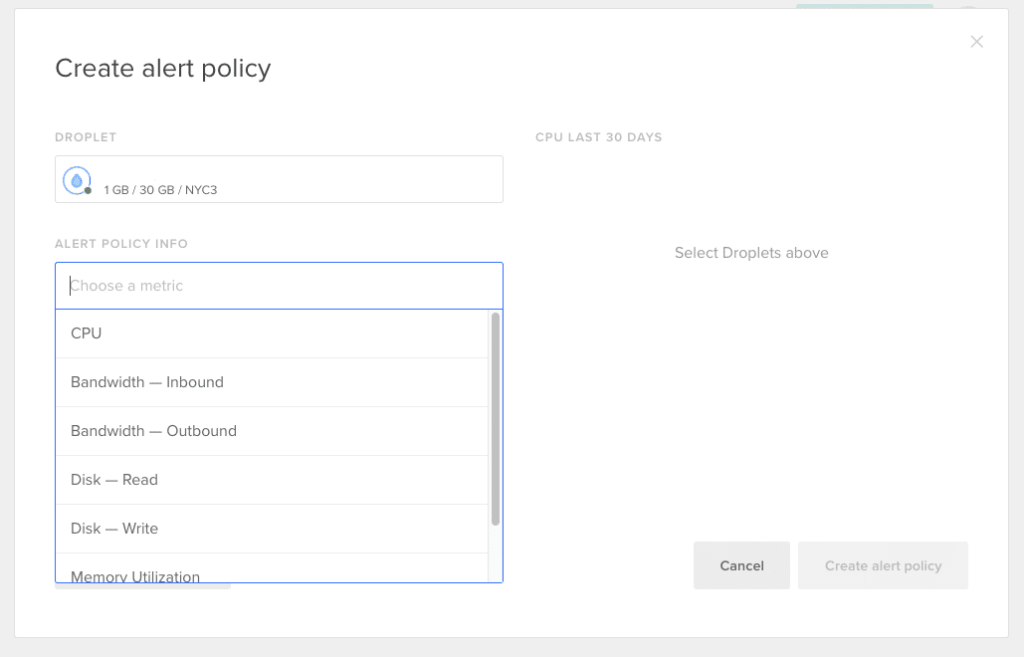
Here is an example of an alert policy setup screen:
And here is the list of alerts I set up for one of these droplets:
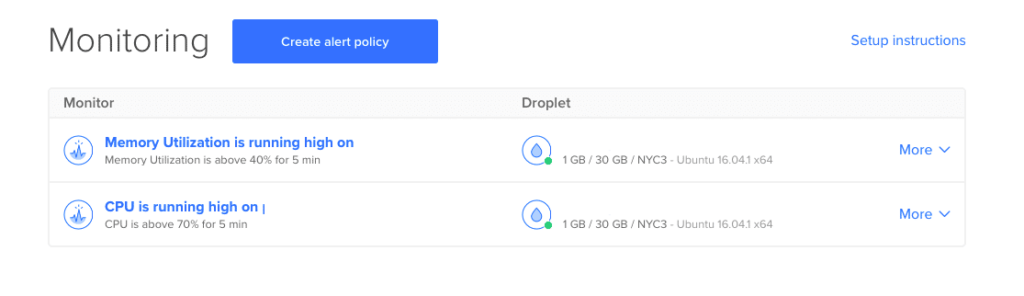
As you can see setting up an alert is really straight forward. And warnings can be emailed or sent to your Slack account. Really awesome. Though an app that sends push notifications would even be better. There is an API though. Will have to look into that some other time.
Graphs Beta
Graphs beta will start working as soon as you have set up your monitoring on your droplet. As you can see below it is still pretty empty. But that is as I just started using it. I like the layout. Easy to see things from a bird’s eye view so to speak.
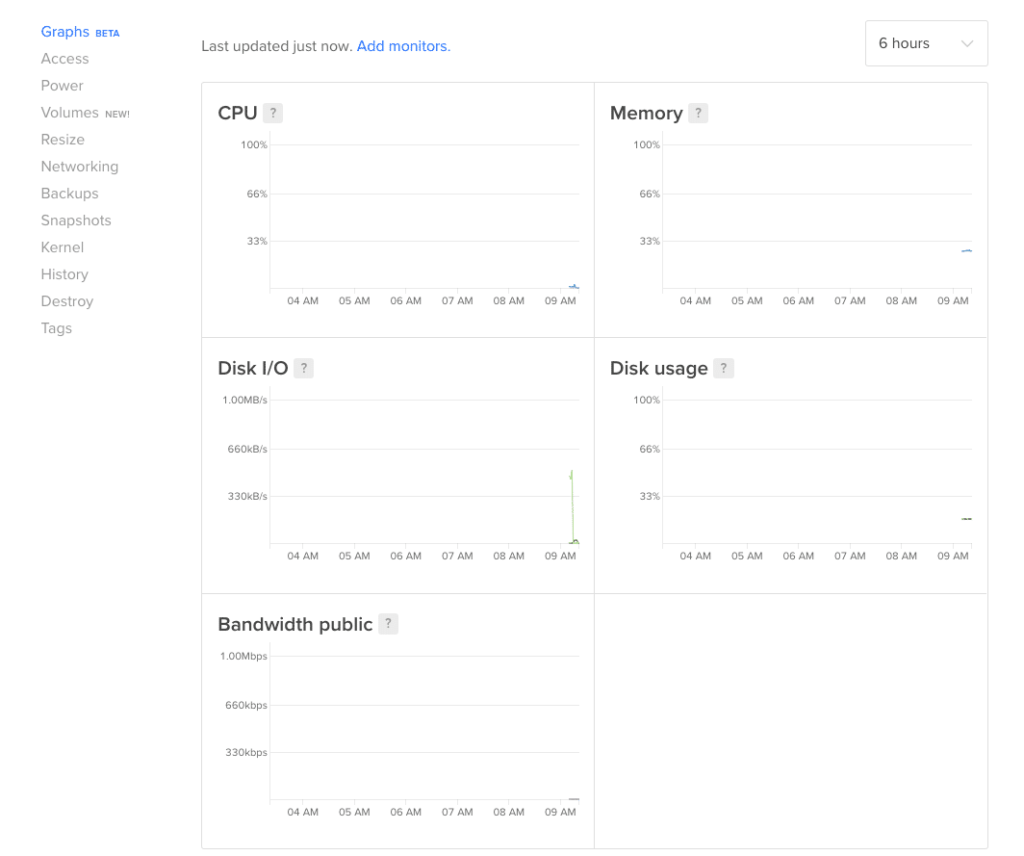
Graphs will be good to check out the history when you do get an alert. This to see if there was just a spike or whether the usage has gone and your droplet may need an upgrade.
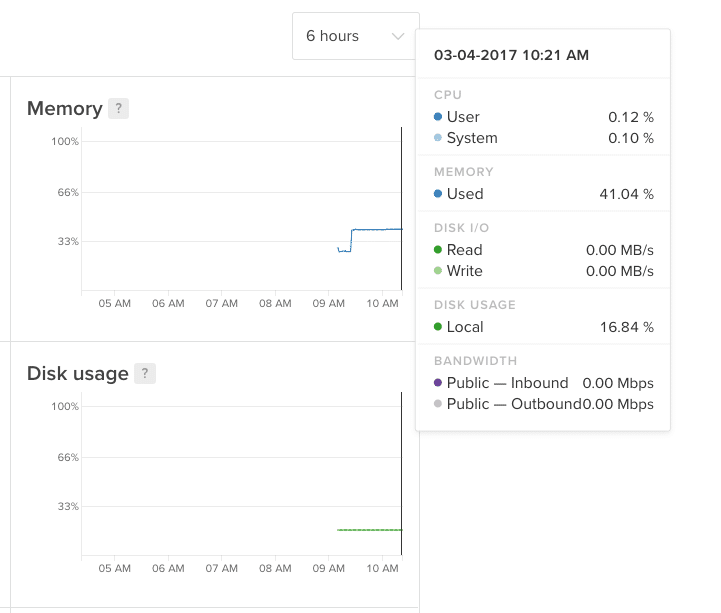
Bonus
Moving on the graph of one of the monitors will show you details: